
Demand and Long Waits Keep the Market Balanced
New York’s housing market gives buyers room to compare without leaving sellers short of demand. The RealSights Market Pulse is 45, a balanced reading as of November 8, 2026. Two forces explain that score: strong pending demand relative to the homes available supports sellers, while long waits on the market give buyers breathing room.
Active listings have spent 110 days on the market. Homes that sold during the past six months took 94 days to sell—a moderate pace, rather than a fast one. Those measures describe different groups: homes still available and homes that completed a sale. Together, they show why meaningful buyer interest can coexist with a lengthy selling process.
For consumers, balanced does not mean effortless. Buyers have time to compare choices, while sellers face a market where pricing and presentation matter. The citywide figures do not establish that either side has the upper hand on every home.
What the Pending Ratio Means
New York has a pending ratio of 52%, with 4,410 pending homes against 8,562 active listings. In everyday terms, about 5-6 out of every 10 homes for sale are finding a buyer—an even market.
The ratio compares homes with a buyer lined up, including all under-contract listings, with homes still for sale. It is a snapshot of demand beside available supply. It does not mean that 52% of today’s listings will sell within a particular time.
The seller takeaway is straightforward: homes are finding buyers, but shoppers have alternatives. A competitive asking price and a well-presented home matter. For buyers, the same reading leaves room to compare a few homes rather than treating every listing as a race. The [New York market report](/new-york/new-york) provides the broader AreaPro snapshot behind these conditions.
Buyers Can Compare, Sellers Need Patience
Homes that sold during the past six months took 94 days to sell, a moderate pace. The 110 days recorded for active listings describe homes still on the market, not a deadline for when they will find buyers. Neither measure establishes how long any particular listing will take to sell.
For buyers, those waits provide context for comparing a home’s condition, asking price and competing listings. Time on the market alone does not establish that a seller will accept less. The balanced citywide reading supports comparison rather than an assumption that every property requires an immediate offer.
For sellers, the combination of demand and lengthy waits makes pricing and presentation important. Homes are finding buyers, but the completed-sale timeline underscores that selling can require patience. The active-listing figure also shows why buyer interest should not be confused with a quick sale.
Sale Prices Put Asking Prices in Perspective
New York’s median sold price is $2,042,436. That is the midpoint of recorded sale prices, not a valuation for an individual home. Differences in property type, condition and neighborhood limit what a citywide median can tell a buyer or seller about a particular asking price.
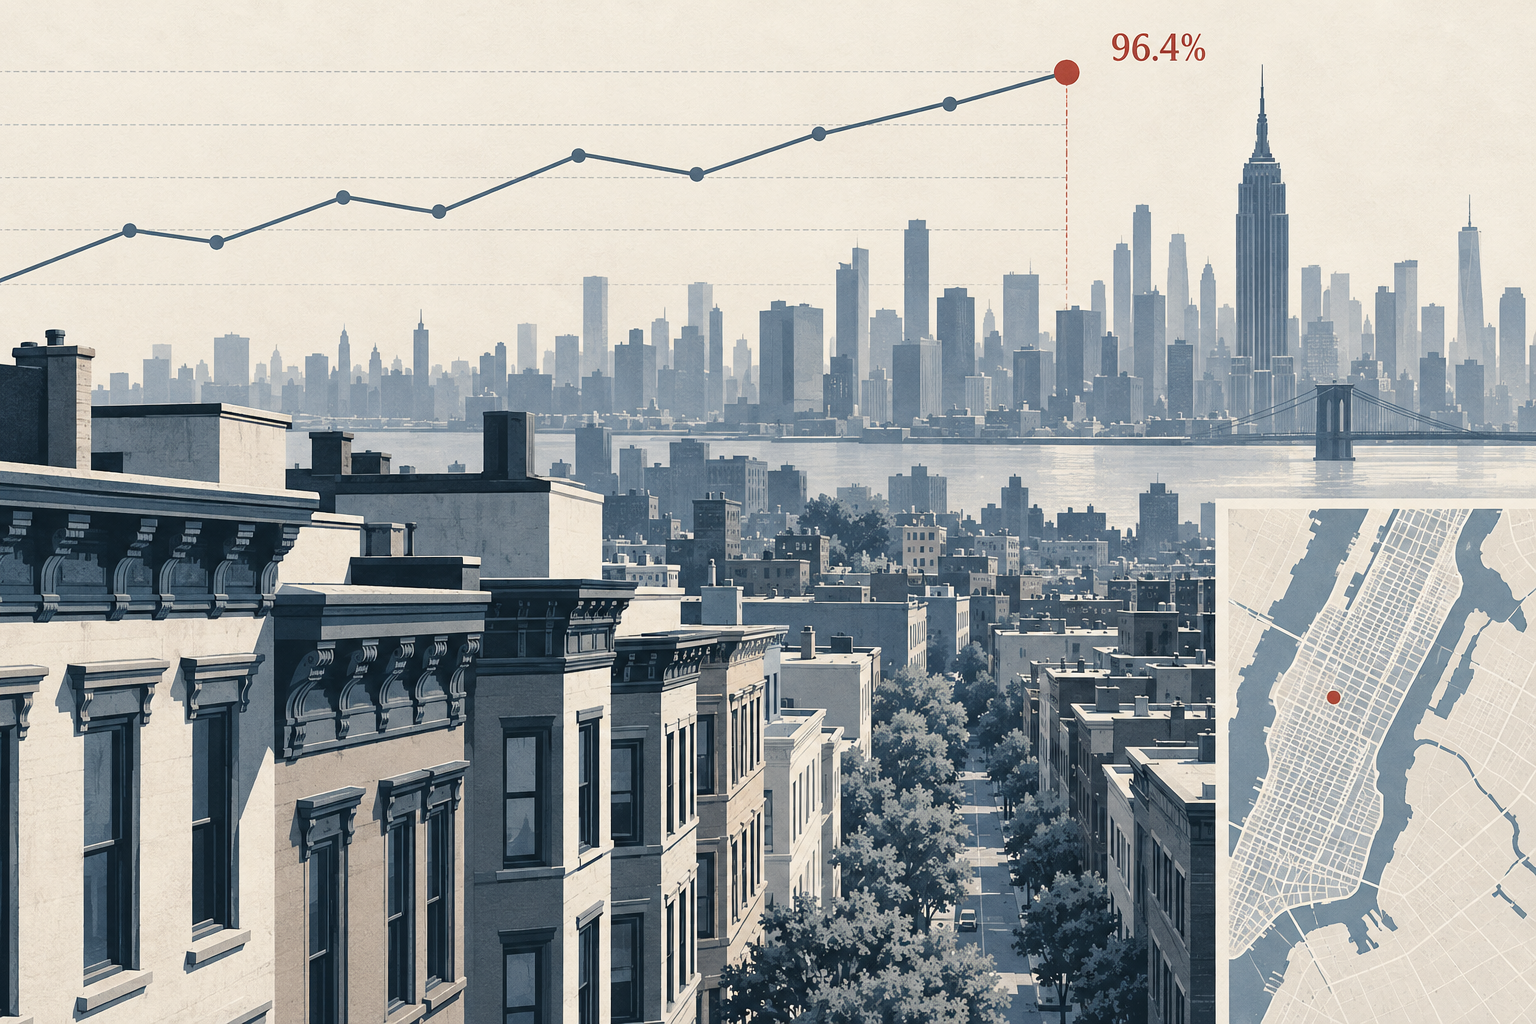
The sale-to-final-list measure is 99.7%, placing completed sale prices close to final asking prices. The sale-to-original-list measure is lower, at 96.4%. These figures use different reference points: the final asking price and the price at which a home was originally offered.
That distinction matters when interpreting apparent seller strength. Selling close to the final asking price does not necessarily mean achieving the original ask. For buyers, the figures put listing prices in context without establishing a standard discount. For sellers, they underline why the original asking price and the eventual sale price should not be treated as interchangeable.
The Snapshot Behind the Briefing
This RealSights briefing draws on AreaPro weekly snapshots as of November 8, 2026. The snapshot includes 8,206 closings over the past six months; that completed-sale window provides context for the reported 94 days to sell, rather than measuring only the latest week’s activity.
The figures describe current citywide conditions, not a forecast or a valuation for any particular property. Active listings and pending homes capture different stages of the selling process, while completed sales show outcomes for homes that have already closed. Reading those measures together helps explain why demand can support sellers even when buyers have time to compare.
The [New York market report](/new-york/new-york) brings these measures together. Its balanced reading is best understood as context for evaluating individual homes, where neighborhood, condition and asking price still matter.